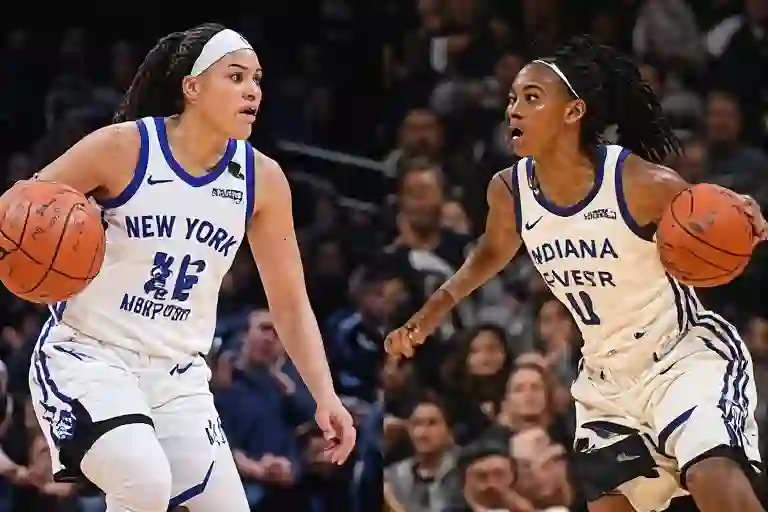
A final score can hide the real story. New York led early, Indiana changed the pace, and one third-quarter swing turned a close contest into a 20-point result. This guide organizes the New York Liberty vs Indiana Fever Match Player Stats into clear tables, player notes, shooting splits, and simple explanations. You will see who performed well, where the game changed, and why Indiana won.
What Is the Quick Answer?
Indiana Fever beat the New York Liberty 108-88 on July 18, 2026, at Gainbridge Fieldhouse. Kelsey Mitchell led all scorers with 33 points on 10-of-14 shooting, while Caitlin Clark added 17 points. Breanna Stewart led New York with 26 points, and Marine Johannès scored 12 before leaving with an ankle injury.
The New York Liberty vs Indiana Fever Match Player Stats show that Indiana won through better shooting, stronger second-half execution, and more production from New York’s mistakes. The Fever shot 53.6% from the field and 50% from three while scoring 30 points off turnovers.
Match Overview
| Match Detail | Information |
|---|---|
| Competition | WNBA regular season |
| Date | July 18, 2026 |
| Venue | Gainbridge Fieldhouse, Indianapolis |
| Final Score | Indiana Fever 108, New York Liberty 88 |
| Halftime Score | New York Liberty 49, Indiana Fever 45 |
| Leading Scorer | Kelsey Mitchell, 33 points |
| New York Leading Scorer | Breanna Stewart, 26 points |
| Main Turning Point | Indiana’s dominant third quarter |
| Indiana Record After Game | 16-10 |
| New York Record After Game | 13-12 |
These latest matchup numbers matter because they explain more than the result. New York controlled the opening phase, but Indiana remained close enough to attack after halftime. The Fever then raised their defensive pressure, converted turnovers, and built a lead New York could not erase.
Key Player Stats Snapshot
The table below focuses on the main performers and the numbers that shaped the game.
| Player | Team | Points | Other Verified Stats | Main Impact |
| Kelsey Mitchell | Indiana Fever | 33 | 10-14 FG, 4-6 3PT, 9-13 FT, 1 AST, 1 STL | Most efficient scorer and primary closer |
| Caitlin Clark | Indiana Fever | 17 | 7 AST, 7 TO, 26 MIN | Created shots, changed pace, and made key second-half baskets |
| Breanna Stewart | New York Liberty | 26 | 10-16 FG, 8 REB | Kept New York competitive as its most reliable scorer |
| Marine Johannès | New York Liberty | 12 | 4-8 3PT | Powered the fast start before leaving injured |
| Sabrina Ionescu | New York Liberty | 12 | 1 REB, 4 AST | Added playmaking but could not stop the second-half swing |
| Pauline Astier | New York Liberty | 9 | 5 AST, 3-6 FG | Added secondary creation and efficient guard play |
Mitchell’s shooting line and Stewart’s scoring efficiency were central to the New York Liberty vs Indiana Fever Match Player Stats. Clark’s seven assists also mattered because Indiana’s offense did not depend on one scorer alone. Astier supplied nine points and five assists for New York.
Full Team Statistics Table
| Team Stat | New York Liberty | Indiana Fever | Edge |
| Points | 88 | 108 | Indiana |
| Field Goals | 30-67 | 37-69 | Indiana |
| Field-Goal Percentage | 44.8% | 53.6% | Indiana |
| Three-Pointers | 13-32 | 14-28 | Indiana |
| Three-Point Percentage | 40.6% | 50.0% | Indiana |
| Free Throws | 15-25 | 20-27 | Indiana |
| Free-Throw Percentage | 60.0% | 74.1% | Indiana |
| Total Rebounds | 27 | 32 | Indiana |
| Offensive Rebounds | 7 | 8 | Indiana |
| Turnovers | 15 | 16 | New York by one |
| Points Off Turnovers | 17 | 30 | Indiana |
| Personal Fouls | 24 | 24 | Even |
These numbers show why the final margin reached 20 points. Indiana made seven more field goals, shot nearly nine percentage points better overall, and gained a 13-point advantage in points off turnovers. The Fever also finished more possessions at the free-throw line.
The comparison points to efficiency, not simply shot volume. Both teams attempted a similar number of field goals, yet Indiana produced 20 more points because it made better shots and punished mistakes more often.
How Did Each Quarter Change the Game?
| Quarter | New York Liberty | Indiana Fever | Quarter Winner |
| First | 28 | 22 | New York |
| Second | 21 | 23 | Indiana |
| Third | 12 | 30 | Indiana |
| Fourth | 27 | 33 | Indiana |
| Final | 88 | 108 | Indiana |
New York opened with sharp three-point shooting and led 49-45 at halftime. Indiana then took its first lead early in the third quarter and outscored New York 30-12 in the period. That 18-point quarter swing changed the contest.
The New York Liberty vs Indiana Fever Match Player Stats become much easier to understand when viewed by quarter. New York won the opening quarter by six, but Indiana won the final three quarters by 26 combined points.
Why Was Kelsey Mitchell the Best Player?
Kelsey Mitchell produced the game’s strongest scoring performance. She scored 33 points while making 10 of 14 field-goal attempts, four of six three-pointers, and nine of 13 free throws. That level of efficiency forced New York to change its defensive coverage and gave Indiana a dependable scoring option whenever the game tightened.
Her impact grew after halftime. Mitchell scored 14 points in the third quarter, coming close to matching New York’s entire team output during the decisive period. Her shot-making turned defensive stops into a wider lead and prevented the Liberty from settling back into their first-half rhythm.
In the New York Liberty vs Indiana Fever Match Player Stats, Mitchell stands out for three reasons:
- She led every player in scoring.
- She combined scoring volume with high efficiency.
- She delivered her biggest scoring burst during the decisive quarter.
Mitchell did not rely only on three-pointers. She scored from outside, attacked open space, and reached the free-throw line 13 times. That variety made her difficult to defend with one coverage.
How Did Caitlin Clark Influence the Result?
Caitlin Clark finished with 17 points and seven assists in 26 minutes. She also committed seven turnovers, so her statistical line was not perfect. Still, she created important scoring chances, pushed the ball forward, and made baskets that helped Indiana take control after halftime.
Clark converted a three-point play that gave Indiana its first lead early in the third quarter. Later, she made fourth-quarter three-pointers and assisted on interior scores as the Fever protected their advantage.
The New York Liberty vs Indiana Fever Match Player Stats show that Clark’s value came from pressure and creation as much as points. New York had to defend her shooting range, passing angles, and transition pace at the same time.
Her presence also created more room for Mitchell. When defenders moved toward Clark, Mitchell received cleaner opportunities. When New York remained attached to Mitchell, Clark found passing lanes toward the paint.
What Did Breanna Stewart Do Well?
Breanna Stewart gave New York its best scoring performance. She finished with 26 points on 10-of-16 shooting and collected eight rebounds. Her scoring kept the Liberty within reach during stretches when the offense became rushed or disconnected.
Stewart scored from the paint, mid-range areas, the three-point line, and the free-throw line. That variety made her New York’s safest option. However, one strong individual line could not offset Indiana’s team shooting or the points New York allowed after turnovers.
Among the New York Liberty vs Indiana Fever Match Player Stats, Stewart’s line shows both her quality and New York’s larger problem. The Liberty needed more stable help around their leading scorer.
Indiana also made Stewart work on both ends. She had to score, rebound, defend switches, and help protect the paint. That workload became harder to maintain as the game moved into the second half.
Which Supporting Players Changed the Match?
Marine Johannès
Johannès scored 12 points by making four of eight three-point attempts. She made all four threes during the opening seven minutes and helped New York establish an early double-digit advantage. She later left the game with an ankle injury.
Her early shooting stretched Indiana’s defense. However, New York could not maintain that same level of outside accuracy throughout the remaining quarters.
Sabrina Ionescu
Ionescu scored 12 points and added four assists. She helped New York move the ball early, but Indiana’s pressure reduced her control over the game in the second half.
She made four of nine field-goal attempts, including two of four from three. New York needed more shot creation from Ionescu after Indiana started sending added pressure toward Stewart.
Pauline Astier
Astier finished with nine points and five assists while shooting three of six from the field. She provided secondary playmaking and attacked the basket when Indiana pressured the perimeter.
Her performance was useful, but New York still lacked enough scoring across the full rotation.
Aliyah Boston
Boston contributed through screening, rebounding, passing, and interior finishing. Her activity gave Clark and Mitchell cleaner driving routes, while her seven rebounds helped Indiana win the overall rebounding battle.
A screen may not appear as a major box-score statistic, but it can create the space that leads to a made shot or assist.
Indiana’s Bench
Indiana’s reserves outscored New York’s bench 31-14. That gap allowed the Fever to keep attacking while starters rested. It also became another reason the lead continued growing in the fourth quarter.
These supporting contributions add context to the New York Liberty vs Indiana Fever Match Player Stats. Star points drew attention, but depth, screens, rebounding, and bench shooting helped decide the result.
Why Did Indiana Fever Win?
Indiana controlled the most valuable parts of the game:
- Better shooting: The Fever made 53.6% of their field goals and 50% of their threes.
- Turnover punishment: Indiana scored 30 points off turnovers.
- Third-quarter defense: New York scored only 12 points in the third.
- Bench production: Indiana’s bench won its scoring battle by 17 points.
- Free-throw advantage: The Fever made five more free throws.
- Late-game finishing: Indiana scored 33 points in the fourth quarter.
- Balanced pressure: Mitchell scored while Clark created opportunities for teammates.
The New York Liberty vs Indiana Fever Match Player Stats support a clear answer. Indiana did not win through one isolated hot streak. It combined shot-making, defensive pressure, transition scoring, and depth.
The Fever also responded well after falling behind. Instead of forcing difficult shots, Indiana reduced the lead through normal possessions and entered halftime only four points behind.
What Went Wrong for New York Liberty?
New York’s main issue was not its opening game plan. The Liberty built a 13-point lead and shot well from three. The trouble came when Indiana changed the speed and pressure after halftime.
New York struggled in four main areas:
- Ball security: Third-quarter turnovers gave Indiana easier scoring chances.
- Free throws: The Liberty made only 60% of their attempts.
- Defensive recovery: Indiana found open threes and paint finishes.
- Bench scoring: New York received only 14 bench points.
The New York Liberty vs Indiana Fever Match Player Stats suggest that New York needs stronger possession-to-possession control. Hot shooting can build a lead, but clean passing, defensive communication, and free-throw accuracy protect it.
The Liberty also struggled to respond emotionally after Indiana gained momentum. One mistake often led to another. Better teams break those runs with a controlled possession, defensive stop, or timeout adjustment.
Did Turnovers Decide the Match?
Turnovers alone did not decide the game because Indiana also committed mistakes. The difference was what each team did after gaining possession.
Indiana scored 30 points off turnovers, compared with 17 for New York. That 13-point gap represented a major part of the final 20-point margin.
The Fever turned New York’s mistakes into:
- Transition layups
- Open three-point shots
- Free-throw opportunities
- Cross-matches against an unsettled defense
- Extra possessions before New York could organize
This is why total turnovers should never be viewed alone. Points off turnovers provide a clearer picture of how damaging those mistakes became.
How Important Was Three-Point Shooting?
Both teams made at least 13 three-pointers, but Indiana was more efficient. The Fever made 14 of 28 attempts for 50%, while New York made 13 of 32 for 40.6%.
New York started the game by making seven of nine three-point attempts. That hot opening helped the Liberty build their lead. However, they made only six of their next 23 attempts from deep.
Indiana’s shooting remained more stable. Mitchell, Clark, Lexie Hull, Sophie Cunningham, Aliyah Boston, and other contributors helped spread the floor.
The New York Liberty vs Indiana Fever Match Player Stats therefore show that three-point timing mattered as much as the final total. New York’s early makes built a lead, while Indiana’s later makes helped secure the win.
How Does This Result Compare With the Previous 2026 Meeting?
New York won the first regular-season meeting 83-75 on June 6, 2026. Breanna Stewart scored 30 points, Kelsey Mitchell led Indiana with 21, and Caitlin Clark recorded 10 points, nine assists, and seven rebounds.
| 2026 Meeting | Winner | Score | Main Performer |
| June 6, 2026 | New York Liberty | 83-75 | Breanna Stewart, 30 points |
| July 18, 2026 | Indiana Fever | 108-88 | Kelsey Mitchell, 33 points |
This comparison makes the New York Liberty vs Indiana Fever Match Player Stats more valuable for full topical coverage. The teams have shown that either side can control the matchup, but the winning formula changes with shooting, turnovers, player health, and game pace.
In the first meeting, New York controlled the late stages and reached the free-throw line regularly. In the second meeting, Indiana produced a much stronger offensive performance and scored 33 more points.
What Do the Main Basketball Stats Mean?
Readers searching for a WNBA box score may not know what every column shows. These definitions make the statistics easier to understand:
- PTS: Total points scored.
- REB: Total rebounds collected after missed shots.
- AST: Passes that directly create made baskets.
- STL: Steals that take possession from the opponent.
- BLK: Blocked field-goal attempts.
- TO: Turnovers that end a possession without a shot.
- FG: Total field goals made and attempted.
- FG%: Percentage of field-goal attempts made.
- 3PT: Three-point shots made and attempted.
- FT: Free throws made and attempted.
- MIN: Minutes played.
- Plus-minus: Point difference while a player is on the floor.
- Points off turnovers: Points scored after the opponent loses possession.
- Offensive rebounds: Rebounds that give the attacking team another possession.
This section supports answer-engine visibility because it solves related questions without forcing readers to leave the page. It also helps younger or newer fans understand the box score without technical language.
What Should Fans Watch in the Next Matchup?
The next meeting should be judged through a few clear questions:
- Can New York reduce live-ball turnovers?
- Can Indiana repeat its 50% three-point shooting?
- Will New York receive more scoring from its bench?
- Can the Liberty slow Mitchell without opening passing lanes for Clark?
- Will Stewart receive enough support from Ionescu, Jones, and the wings?
- Which team will control the third quarter?
- Can New York improve its free-throw percentage?
- Will injuries change either team’s rotation?
The New York Liberty vs Indiana Fever Match Player Stats can change quickly from one game to the next. Injuries, rotations, minutes limits, and shooting variation all affect the final line, so this page should be updated after each completed meeting.
Recommended Topic Cluster for Topical Authority
Use this pillar page as the central hub and link it to supporting articles such as:
- Caitlin Clark stats vs New York Liberty
- Kelsey Mitchell career-high games
- Breanna Stewart stats vs Indiana Fever
- Liberty vs Fever head-to-head history
- Indiana Fever team shooting trends
- New York Liberty turnover analysis
- WNBA player stats explained
- Liberty vs Fever injury report
- Liberty vs Fever predictions and key matchups
- New York Liberty player statistics
- Indiana Fever player statistics
- Best WNBA rivalries to watch
Each supporting article should link back to this New York Liberty vs Indiana Fever Match Player Stats page with natural anchor text. The pillar page should also link to every related article so search engines can understand the full topic cluster.
Do not publish several pages targeting the exact same keyword. Give each supporting page a clear purpose and unique search intent.
Trust, Sources, and Update Method
For strong E-E-A-T signals, publish this page with a real author profile, visible update date, correction policy, and source notes. Avoid claiming first-hand attendance unless the writer attended the game.
Use these primary sources for future updates:
- Official WNBA game page and box score for the July 18, 2026 matchup.
- Indiana Fever’s official game recap.
- New York Liberty’s official game recap and news page.
- Official WNBA game page for the June 6, 2026 meeting.
Before every update, confirm:
- Match date
- Final score
- Active roster
- Injuries
- Player minutes
- Individual totals
- Team shooting numbers
- Quarter scores
- Source publication date
Add a correction note when a source changes a statistic. Do not quietly replace a disputed figure without explaining the update.
Frequently Asked Questions
Who won the latest New York Liberty vs Indiana Fever game?
Indiana Fever won 108-88 on July 18, 2026. Indiana recovered from a 13-point deficit and took control after halftime.
Who scored the most points in the match?
Kelsey Mitchell scored a game-high 33 points. She shot 10-of-14 from the field and made four three-pointers.
What were Caitlin Clark’s stats against New York Liberty?
Clark recorded 17 points and seven assists in 26 minutes. She also had seven turnovers, but her passing and second-half scoring helped Indiana pull away.
What were Breanna Stewart’s stats against Indiana Fever?
Stewart led New York with 26 points on 10-of-16 shooting and added eight rebounds.
What was the biggest reason Indiana Fever won?
Indiana shot more efficiently and scored 30 points off turnovers. The Fever also outscored New York 30-12 in the third quarter.
Where can I find the official Liberty vs Fever box score?
The official WNBA game page provides the canonical summary, box score, game charts, and play-by-play for the July 18, 2026 matchup.
Final Takeaway
The New York Liberty vs Indiana Fever Match Player Stats tell a direct story. New York started fast, but Indiana played the cleaner and more efficient second half. Mitchell delivered the biggest scoring performance, Clark created key chances, and the Fever turned New York’s mistakes into points.
New York’s 13-point advantage disappeared because the Liberty could not protect the ball, defend Indiana’s shooters, or match the Fever’s bench production. Stewart remained productive, but she did not receive enough consistent support after halftime.
Keep this page current after every matchup. Update the opening answer, player tables, injuries, head-to-head section, and FAQs while preserving the same URL. That approach gives readers one dependable resource and helps the page build lasting topical authority.