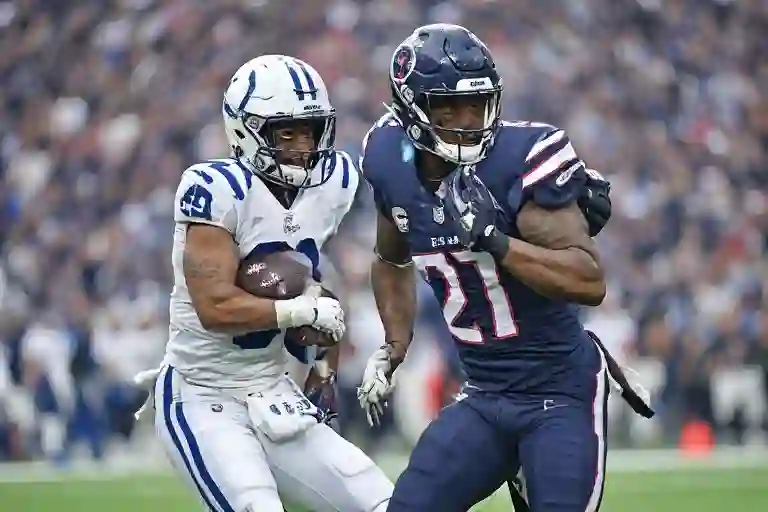
Box scores can hide the real story. A quarterback may throw for more yards and still lose, while a running back can change a game in only a few touches. This Indianapolis Colts vs Tennessee Titans Match Player Stats guide solves that problem by comparing every major number, explaining the turning points, and showing why Indianapolis won 38-14 at Lucas Oil Stadium on October 26, 2025.
Editorial standard: The raw numbers below come from official NFL gamebooks and official team reports. Calculated totals are clearly labeled so readers can separate recorded statistics from editorial analysis.
Indianapolis Colts vs Tennessee Titans Match Player Stats: Quick Answer
Who won? The Indianapolis Colts defeated the Tennessee Titans 38-14. Jonathan Taylor produced the strongest individual performance with 153 rushing yards, 21 receiving yards, and three total touchdowns.
Daniel Jones also played an efficient game, completing 21 of 29 passes for 272 yards, three touchdowns, and no interceptions. Tennessee quarterback Cam Ward threw for 259 yards, but four sacks, one interception, and limited scoring drives kept the Titans from matching Indianapolis.
Fast Game Summary
| Category | Result |
|---|---|
| Final score | Colts 38, Titans 14 |
| Date | October 26, 2025 |
| Venue | Lucas Oil Stadium, Indianapolis |
| Top passer | Daniel Jones, 272 yards |
| Top rusher | Jonathan Taylor, 153 yards |
| Top receiver | Michael Pittman Jr., 95 yards |
| Turnover edge | Colts, 1-0 |
| Total-yard edge | Colts, 420-341 |
| Touchdown edge | Colts, 5-2 |
The official NFL gamebook lists Indianapolis with 420 total yards, five touchdowns, and no turnovers. Tennessee finished with 341 yards, two touchdowns, and one interception.
What Happened in the Colts vs Titans Game?
Indianapolis led 10-0 after the first quarter and 17-7 at halftime. The game broke open when Jonathan Taylor scored on an 80-yard run early in the third quarter, giving the Colts a 24-7 advantage.
The Colts added touchdown catches by Josh Downs and Taylor, while the defense stopped Tennessee from building a sustained comeback. The Indianapolis Colts vs Tennessee Titans Match Player Stats show that the Colts did not need more possession time; they won through explosive plays, better passing efficiency, and stronger scoring output.
Complete Passing Stats
Daniel Jones controlled the game with accuracy and clean decision-making. Cam Ward generated a similar gross passing total, but Indianapolis forced him into a lower completion rate, four sacks, and one interception.
| Player | Team | Cmp-Att | Cmp. % | Pass Yds | TD | INT | Sacks-Yds | Long | Rating |
| Daniel Jones | Colts | 21-29 | 72.4% | 272 | 3 | 0 | 3-16 | 50 | 136.0 |
| Riley Leonard | Colts | 0-2 | 0.0% | 0 | 0 | 0 | 0-0 | 0 | 39.6 |
| Cam Ward | Titans | 22-38 | 57.9% | 259 | 1 | 1 | 4-31 | 26 | 76.5 |
The key difference was not simply passing yards. Jones averaged more yards per attempt, threw three scores, and avoided a turnover, while Ward needed nine more attempts to finish 13 yards behind him.
Complete Rushing Stats
The rushing table provides the clearest explanation for the result. Indianapolis ran only 18 times, yet gained 164 yards because Taylor repeatedly turned small openings into large gains.
| Player | Team | Carries | Rush Yds | Avg. | Long | Rush TD |
| Jonathan Taylor | Colts | 12 | 153 | 12.8 | 80 | 2 |
| Ameer Abdullah | Colts | 2 | 5 | 2.5 | 3 | 0 |
| Daniel Jones | Colts | 1 | 3 | 3.0 | 3 | 0 |
| Tyler Goodson | Colts | 2 | 2 | 1.0 | 2 | 0 |
| Riley Leonard | Colts | 1 | 1 | 1.0 | 1 | 0 |
| Tyjae Spears | Titans | 9 | 59 | 6.6 | 41 | 1 |
| Tony Pollard | Titans | 11 | 44 | 4.0 | 11 | 0 |
| Julius Chestnut | Titans | 2 | 5 | 2.5 | 5 | 0 |
| Cam Ward | Titans | 2 | 4 | 2.0 | 7 | 0 |
| Chimere Dike | Titans | 1 | 1 | 1.0 | 1 | 0 |
The Indianapolis Colts vs Tennessee Titans Match Player Stats highlight an unusual efficiency gap: the Colts averaged 9.1 yards per rushing play, while the Titans averaged 4.5. Taylor alone gained 40 more rushing yards than Tennessee’s entire team.
Complete Receiving Stats
Michael Pittman Jr. led all receivers in catches and yards. Alec Pierce added the longest reception of the game, while Taylor and Josh Downs converted their opportunities into touchdowns.
| Player | Team | Targets | Receptions | Rec. Yds | Avg. | Long | TD |
| Michael Pittman Jr. | Colts | 9 | 8 | 95 | 11.9 | 21 | 1 |
| Alec Pierce | Colts | 5 | 2 | 69 | 34.5 | 50 | 0 |
| Tyler Warren | Colts | 5 | 4 | 53 | 13.3 | 20 | 0 |
| Josh Downs | Colts | 3 | 3 | 39 | 13.0 | 18 | 1 |
| Jonathan Taylor | Colts | 2 | 2 | 21 | 10.5 | 19 | 1 |
| Ameer Abdullah | Colts | 1 | 1 | 3 | 3.0 | 3 | 0 |
| Ashton Dulin | Colts | 1 | 1 | -8 | -8.0 | -8 | 0 |
| Chimere Dike | Titans | 8 | 7 | 93 | 13.3 | 21 | 0 |
| Chig Okonkwo | Titans | 5 | 4 | 53 | 13.3 | 23 | 0 |
| Elic Ayomanor | Titans | 8 | 4 | 52 | 13.0 | 26 | 0 |
| Tyjae Spears | Titans | 3 | 3 | 23 | 7.7 | 17 | 0 |
| Gunnar Helm | Titans | 3 | 2 | 23 | 11.5 | 22 | 1 |
| Tony Pollard | Titans | 2 | 1 | 9 | 9.0 | 9 | 0 |
| Van Jefferson | Titans | 8 | 1 | 6 | 6.0 | 6 | 0 |
Tennessee’s target distribution also reveals a costly problem. Van Jefferson received eight targets but caught one pass for six yards, leaving several drives without a productive finish.
Complete Team Stats Comparison
The team totals show that Tennessee moved the ball at times, but Indianapolis created more value from fewer plays. The Colts gained 420 yards on 52 offensive plays, compared with 341 yards on 67 plays for the Titans.
| Team statistic | Titans | Colts |
| First downs | 20 | 21 |
| Total net yards | 341 | 420 |
| Offensive plays | 67 | 52 |
| Yards per play | 5.1 | 8.1 |
| Net rushing yards | 113 | 164 |
| Rush yards per play | 4.5 | 9.1 |
| Net passing yards | 228 | 256 |
| Third-down efficiency | 6/15, 40.0% | 3/9, 33.3% |
| Fourth-down efficiency | 1/3, 33.3% | 1/1, 100% |
| Red-zone efficiency | 2/3, 66.7% | 3/4, 75.0% |
| Sacks allowed | 4 | 3 |
| Turnovers | 1 | 0 |
| Time of possession | 34:21 | 25:39 |
| Touchdowns | 2 | 5 |
The Indianapolis Colts vs Tennessee Titans Match Player Stats prove why time of possession can be misleading. Tennessee held the ball almost nine minutes longer, but Indianapolis averaged three more yards per offensive play and scored on explosive gains.
Jonathan Taylor’s Dominant Performance
Jonathan Taylor was the game’s most valuable player. He recorded 12 carries for 153 yards and two rushing touchdowns, then added two catches for 21 yards and another score.
His 80-yard touchdown changed the shape of the game. It came on a one-play drive and pushed the lead from 17-7 to 24-7, forcing Tennessee to rely more heavily on the pass.
Taylor finished with:
- 174 yards from scrimmage
- Three total touchdowns
- 12.8 yards per carry
- An 80-yard rushing touchdown
- A 19-yard receiving touchdown
Any useful Indianapolis Colts vs Tennessee Titans Match Player Stats analysis must place Taylor first because he created points, field-position pressure, and tactical stress with very few touches.
Daniel Jones’ Passing Efficiency
Daniel Jones did not need 40 attempts to control the game. He completed 72.4% of his passes, averaged about 9.4 yards per attempt, and produced three touchdown passes without an interception.
Jones connected with six Colts receivers and generated scores through different parts of the formation. Pittman won underneath and in the intermediate area, Pierce supplied the deep gain, Downs found space near the goal line, and Taylor punished a defensive mismatch out of the backfield.
His 136.0 passer rating reflects the full performance: accuracy, touchdowns, explosive gains, and ball security. The Colts’ passing attack stayed aggressive without becoming careless.
How the Colts’ Receivers Created Balance
Pittman was the volume leader, catching eight of nine targets for 95 yards and a touchdown. Pierce caught only two passes, but his 69 yards included a 50-yard gain that stretched Tennessee’s defense.
Tyler Warren contributed four catches for 53 yards, while Downs caught all three of his targets. This balance stopped the Titans from placing all their attention on Taylor.
The Indianapolis Colts vs Tennessee Titans Match Player Stats show five Indianapolis players with at least 21 receiving yards. That spread made the offense harder to predict and allowed Jones to take the best available matchup.
Cam Ward’s Performance Under Pressure
Cam Ward completed 22 of 38 passes for 259 yards, one touchdown, and one interception. His 57.9% completion rate and 76.5 passer rating reflect a game with some productive throws but limited drive-ending success.
Indianapolis sacked Ward four times for 31 lost yards. DeForest Buckner, Neville Gallimore, Adetomiwa Adebawore, Kenny Moore II, and Laiatu Latu contributed to the sack total.
Ward’s touchdown pass to Gunnar Helm cut the first-half deficit to 10-7. After that, Tennessee failed to score again until Tyjae Spears’ late rushing touchdown with 2:36 left.
What Worked and Failed for the Titans’ Offense?
Tennessee found useful production from Tyjae Spears, who averaged 6.6 yards per carry and scored once. Chimere Dike also delivered seven catches for 93 yards, giving Ward a reliable option.
The offense still struggled in five areas:
- Explosive passing: Tennessee’s longest completion gained 26 yards, nearly half the length of Indianapolis’ longest pass.
- Protection: Four sacks erased 31 passing yards.
- Target conversion: Van Jefferson caught one of eight targets.
- Scoring pace: The Titans produced two touchdowns across 11 possessions.
- Turnovers: Ward’s fourth-quarter interception ended a long drive inside Colts territory.
These Indianapolis Colts vs Tennessee Titans Match Player Stats explain why respectable yardage did not become a close score.
Defensive Player Stats and Key Stops
Germaine Pratt led Indianapolis with eight combined tackles. The Colts also recorded four sacks, eight tackles for loss, seven quarterback hits, one interception, and four passes defended.
| Colts defender | Combined tackles | Sacks | TFL | QB hits | INT |
| Germaine Pratt | 8 | 0 | 1 | 0 | 0 |
| Kenny Moore II | 5 | 0.5 | 0 | 1 | 0 |
| DeForest Buckner | 2 | 1.0 | 1 | 2 | 0 |
| Neville Gallimore | 2 | 1.0 | 1 | 1 | 0 |
| Adetomiwa Adebawore | 1 | 1.0 | 1 | 1 | 0 |
| Laiatu Latu | 2 | 0.5 | 0 | 1 | 0 |
| Chris Lammons | 2 | 0 | 0 | 0 | 1 |
Tennessee’s defense recorded three sacks and five tackles for loss. Roger McCreary, Dre’Mont Jones, and T’Vondre Sweat each recorded a sack, but the unit could not stop Taylor’s explosive runs or Jones’ touchdown passes.
Scoring Timeline: How Indianapolis Built the Lead
| Quarter | Time | Scoring play | Score |
| Q1 | 9:43 | Michael Badgley 43-yard field goal | Colts 3-0 |
| Q1 | 0:09 | Jonathan Taylor 18-yard touchdown run | Colts 10-0 |
| Q2 | 11:14 | Gunnar Helm 1-yard TD catch from Cam Ward | Colts 10-7 |
| Q2 | 7:44 | Michael Pittman Jr. 21-yard TD catch from Daniel Jones | Colts 17-7 |
| Q3 | 11:10 | Jonathan Taylor 80-yard touchdown run | Colts 24-7 |
| Q3 | 5:12 | Josh Downs 10-yard TD catch from Daniel Jones | Colts 31-7 |
| Q4 | 14:22 | Jonathan Taylor 19-yard TD catch from Daniel Jones | Colts 38-7 |
| Q4 | 2:36 | Tyjae Spears 3-yard touchdown run | Colts 38-14 |
The middle stretch decided the game. Indianapolis scored 28 unanswered points after Tennessee made it 10-7, turning a competitive first half into a comfortable win.
2025 Colts vs Titans Season-Series Stats
Indianapolis also won the first 2025 meeting 41-20 on September 21 at Nissan Stadium. Combining both official gamebooks gives a deeper picture than one isolated box score.
| 2025 series total | Colts | Titans |
| Wins | 2 | 0 |
| Points | 79 | 34 |
| Total yards | 785 | 623 |
| Net rushing yards | 301 | 199 |
| Net passing yards | 484 | 424 |
| Touchdowns | 10 | 4 |
| Turnovers committed | 0 | 2 |
| Sacks made | 8 | 3 |
| Yards per offensive play | 7.5 | 4.7 |
Jonathan Taylor totaled 255 rushing yards and five rushing touchdowns across the two games. He also caught five passes for 37 yards and one touchdown, giving him 292 scrimmage yards and six total scores in the season series.
Daniel Jones completed 39 of 54 passes for 500 yards, four touchdowns, and no interceptions in the two victories. Cam Ward finished 45 of 76 for 478 yards, two touchdowns, two interceptions, and eight sacks taken.
These series totals were calculated from the two official NFL gamebooks. This two-game Indianapolis Colts vs Tennessee Titans Match Player Stats view shows a repeatable pattern: Indianapolis protected the football, created explosive rushing plays, and finished drives with touchdowns.
Which Stats Decided the Game?
1. Yards Per Play
Indianapolis averaged 8.1 yards per play. Tennessee averaged 5.1, meaning the Colts gained far more value each time they snapped the ball.
2. Touchdown Efficiency
The Colts scored five touchdowns, while the Titans scored two. Indianapolis turned its best drives into seven points instead of settling for field goals.
3. Explosive Plays
Taylor’s 80-yard touchdown and Pierce’s 50-yard reception changed field position in seconds. Tennessee did not produce a pass longer than 26 yards.
4. Quarterback Efficiency
Jones threw three touchdowns on 29 attempts. Ward threw one touchdown on 38 attempts and lost 31 yards on sacks.
5. Ball Security
Indianapolis did not commit a turnover. Tennessee threw one interception, and that takeaway removed a late chance to reduce the deficit.
The Indianapolis Colts vs Tennessee Titans Match Player Stats therefore point to efficiency—not possession—as the main reason for the 24-point margin.
How to Read NFL Player Stats Correctly
A box score becomes more useful when readers compare volume with efficiency.
- Completion percentage shows how often a quarterback completed an attempt.
- Yards per attempt measures passing production relative to opportunity.
- Passer rating combines completions, yards, touchdowns, and interceptions.
- Yards per carry measures rushing efficiency but can rise sharply after one long run.
- Catch rate compares receptions with targets.
- Yards from scrimmage combines rushing and receiving yards.
- Sacks and sack yards show how pressure reduced passing output.
- Red-zone efficiency measures how often a team scored a touchdown inside the opponent’s 20-yard line.
- Yards per play provides a quick view of total offensive efficiency.
Readers should avoid judging a player from one number. Ward had 259 passing yards, but his lower completion rate, four sacks, one interception, and one touchdown offer the needed context.
What Do These Stats Mean for Future Colts–Titans Games?
The Indianapolis Colts vs Tennessee Titans Match Player Stats create a clear matchup checklist. Tennessee must limit explosive runs, protect its quarterback, and convert more targets into completions.
Indianapolis should continue using Taylor to force extra defenders near the line, then attack open space with Pittman, Pierce, Downs, and its tight ends. Future rosters and game plans will change, but these matchup principles remain useful when reviewing the next AFC South meeting.
Frequently Asked Questions
Who won the Indianapolis Colts vs Tennessee Titans game?
The Indianapolis Colts won 38-14. Indianapolis led 17-7 at halftime, scored 21 more points after the break, and held Tennessee to one late fourth-quarter touchdown.
Who had the best Indianapolis Colts vs Tennessee Titans Match Player Stats?
Jonathan Taylor had the best overall numbers. He gained 153 rushing yards, 21 receiving yards, and scored three touchdowns on 14 total touches.
How many passing yards did Daniel Jones record?
Daniel Jones threw for 272 yards. He completed 21 of 29 passes, threw three touchdowns, avoided an interception, and finished with a 136.0 passer rating.
How did Cam Ward perform against the Colts?
Cam Ward threw for 259 yards, one touchdown, and one interception. He completed 22 of 38 attempts and was sacked four times for a loss of 31 yards.
Who was the leading receiver in the game?
Michael Pittman Jr. led the game with 95 receiving yards. He caught eight of nine targets and scored on a 21-yard pass from Jones.
What was the biggest reason the Colts beat the Titans?
Explosive efficiency was the biggest reason. Indianapolis averaged 8.1 yards per play, produced five touchdowns, committed no turnovers, and received an 80-yard scoring run from Taylor.
Final Takeaway
The Indianapolis Colts vs Tennessee Titans Match Player Stats tell a simple story: Indianapolis needed fewer plays to create more yards, more touchdowns, and more game-changing moments. Taylor powered the attack, Jones protected the ball, and the Colts’ defense pressured Ward when Tennessee needed a response.
Use this page as the central reference for the matchup, update it after each meeting, and connect it to the supporting cluster pages above. A regularly refreshed stats hub with clear sourcing, original analysis, and useful internal links has a stronger chance to earn repeat visits, search visibility, and editorial citations.
Primary Sources
- NFL official Week 8 game center: Final score, quarter-by-quarter scoring, date, and venue.
- NFL official Week 8 gamebook: Complete individual, team, defensive, and scoring statistics.
- Indianapolis Colts official recap: Game context and Taylor’s three-touchdown performance.
- Tennessee Titans official recap: Ward’s passing numbers and Tennessee’s game summary.
- NFL official Week 3 gamebook: Statistics used to calculate the 2025 season-series totals.